
Navigating Market Volatility
Are you struggling with volatility in the markets?
Here’s my post on understanding what it is and what to do about it.
I often hear traders complain about – every environment as if they’re Goldilocks and the Three Bears.
“iT’s toO mUcH vOlAtILITY”
or
“tHE vIX IS tOo lOw”
Look, that real perfect condition you’re looking for are not going to be most of the time. You’re looking for that sweet spot. That nice – just enough – not too much volatility assuming you have some experience.
If you’re newer at trading – well, god speed.
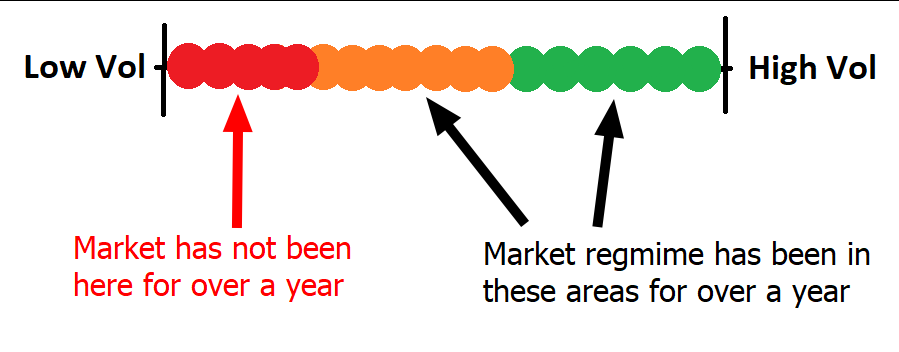
Here’s where you may be living on my little slider scale when you trade well:
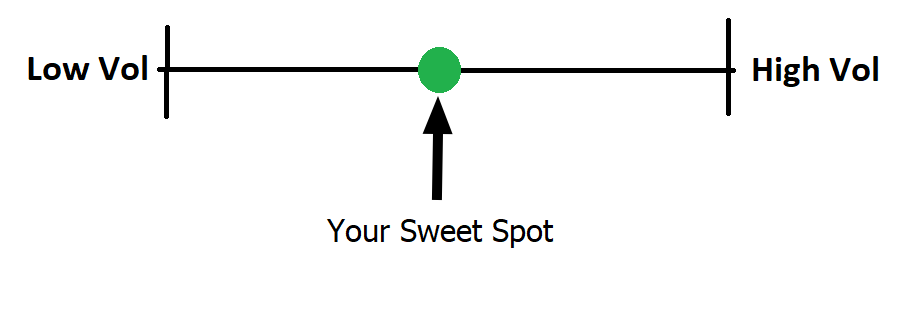
If volatility is too high, you can’t trade for shit because your stops are getting blown, and if it’s too low, every trade under the sun comes back and never runs.
Really it’s a skill issue.
Volatility shifts are what making trading – an already difficult job – even more difficult. Why is that?
First and foremost, one must learn to clearly read price action. Reading price action in itself is an endeavor that can take you years, even a decade to learn. The ability to read price action clearly gives you edge. The more clear you are, the better odds you have at making good trading decisions. The longer you are clear during price action movements the more opportunities you can take advantage of.
I wrote a blog on clarity in markets which you should read.
Okay, let’s assume you have clarity at times and make good trading decisions during very specific volatility regimes. You’ve tasted the sweet delicious fruits of consistency before. However, market regimes or volatility is always shifting.
When I was in my early stages of learning to trade, I’d figure out how to trade a specific regime and it would change. Then it would take me weeks to realize something changed and what I’m doing doesn’t work anymore. Then in a month in I’d figure out how to trade it.
I’d feel high and mighty, but that was always short lived, because the fucking market regime would change again.
I’m just fighting my ass off to jussssssttttt taste victory and boom! Regime shift.
Welcome to trading. This is your baptism by fire. This is what the new booty green horn trader doesn’t not comprehend. Even if I tell them they will not get it. Hell, I heard these things before and I didn’t understand it. Okay, maybe I didn’t hear what I’m writing before but I heard something like it. I heard “you need to adjust your risk according to volatility…“
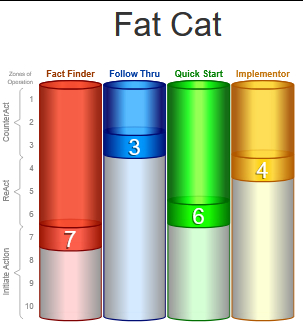
Problem is that was never specific enough. According to my M.O. from the Kolbe index A test, I need specifics which is that red bar. If you have a low rank on red that means you just need simplified things.
The reality is, trading is going to take you years to master – if one can truly master it? – Either way, you need to experience multiple market regimes over and over. You need to learn to trade volatility shifts. Each time the volatility changes you will struggle. You have to learn how to adapt and shift. And as you learn how to adapt and shift, you need to learn how to identify the volatility changes quicker and make that adjustment sooner.
What I’m trying to say is, you’re going to struggle and always feel like you’re a step or two behind the current market regime. Once you gain enough experience under your belt by learning through each volatility shift, then you are truly becoming a seasoned trader.
You have to struggle for years to learn how to make that adaptation. Until you experience both polar opposites of volatility, then you won’t know what to do when it happens and naturally the inexperienced will struggle. It’s just part of the learning curve. This is sort of that missing piece that nobody seems to talk about.
Okay, so lets look at what happens when the volatility goes high and it’s high for a few months. You adjust and you start to get good. Life is great. For now…..
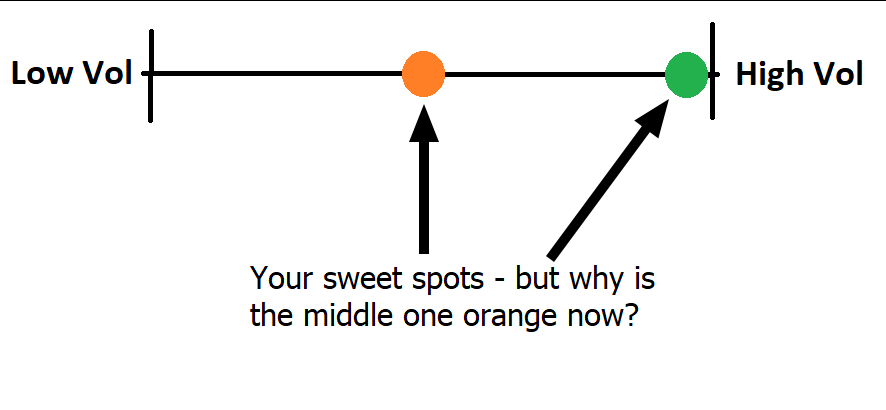
You may notice the middle circle was green on the first screen shot, but now it’s orange? What!?
Yeah, it’s because you’ve been trading in high volatility for a few months as mentioned earlier. You’re used to this new environment in green, so naturally you are out of practice in the older regime. If you think about it, it’s common sense.
If you play baseball and you got good at hitting curve balls then started batting at fast balls for months without hitting a curve ball that entire time, you will need a bit of time to lock in and get the hang of it.
Okay, lets assume volatility goes down and we’re at the sweet spot in the middle again and you’re trading here for months.
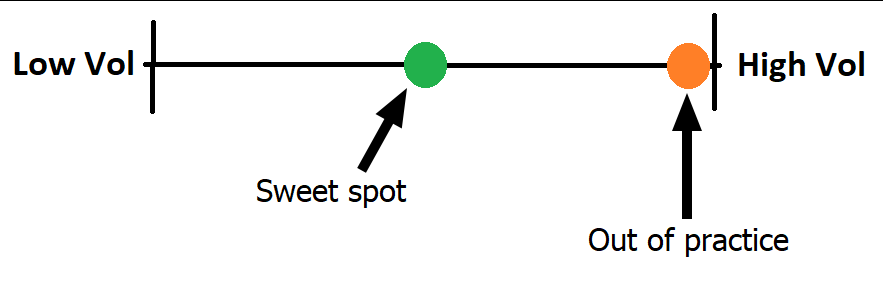
Notice in the above screen shot you’re now out of practice during high volatility. Sometimes the market wont be there for a year or years.
It really takes the ebb and flow of regime shifts and experiencing volatility shifts multiple times over to be able to adapt and maintain consistency. Now there’s more to it as trading really is a deep iceberg of micro skills one must master.
But hey that’s what this entire blog is for. A place for you to dig into other aspects of trader skills.
Now, you may notice there’s a lot of blank spots in between the two dots I drew. I’m sure you can guess by now: Those are regimes you’ve yet to trade. So if you haven’t traded those environments, then how can one possibly master them without any prior experience?
This is exactly why trading takes years to master. Or get consistent…
Lets look at a sweet spot of someone who’s been trading for near a decade.
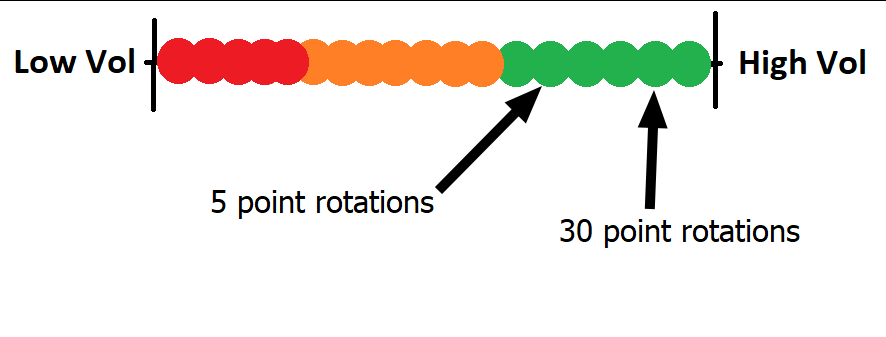
Notice how the highly experienced trader is currently dealing with higher volatility environments as we speak. Now, high volatility doesn’t have one speed, that shit changes minute by minute, day by day. However, it will generally be where the green is. It bounces. In fact, one session can experience volatility across most of this scale to some degree.
It’s like price action. Price action is fractal. You can see a range on a daily chart while at the same time seeing a range on a 30 minute chart, and then you see a range on a 10 second chart. This scale is fractal. We can overall be in high volatility, however we can be ebbing and flowing on a granular level on this scale. So yes its high volatility, but when we look at the session, the average rotation can be 30 points, but now we seem to have the price action get stuck in a 5 point rotation. So you could look at it like the scale below:
Price Action is KING
Now that we’re on the topic of rotations and we have the example above pointing out rotations, how can one know what the volatility is?
Some would say look at the VIX, which is the volatility index. If it’s above 30 you’ll see about 20 point rotations. If it’s 14 then it’s really bad volatility where the rotations are 1 point.
I’ve looked at VIX and I don’t think it’s all that helpful because as a scalper myself ,the volatility is shifting throughout the session. Like I mentioned, it can go from 30 point rotations to 5 in a matter of minutes. Meanwhile, VIX will be pinned in the 30s. Hell VIX can be 30s and the market maybe rotating 2 points at the moment. So yeah, VIX is an overall view of what’s happening but there’s something better than that.
What you may ask?
Price action.
Price action is the most under rated thing in trading. Especially for noobs because they pile on indicators, order flow, ATRs, etc. Price action is king. Once you know you know. Price action will pretty much tell you everything you need to know.
So what can it tell us about volatility?
First let me share with you a hack. For some of you, it maybe obvious that taller price bars on a chart signify more volatility – and you’d be right.
However how much more volatility? See this is the issue. Having horizontal lines on a chart every 5 points if you trade something like ES Eminis, which is my specialty.
Let me share a screenshot showcasing these lines:
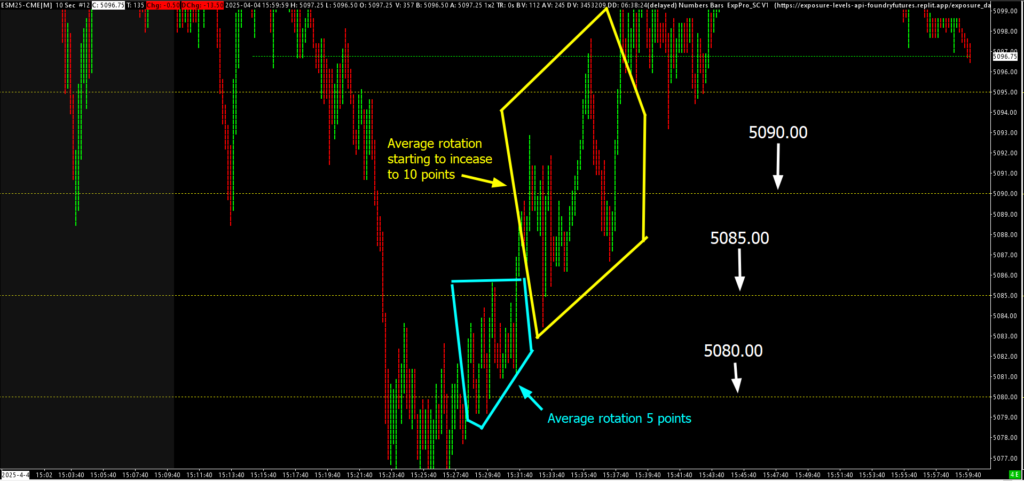
Notice the yellow dotted lines. These are plotted every 5 points or 20 ticks – ticks being the minimum measurement of movement in ES. There’s 4 ticks for 1 point.
Seeing the way the price bars rotate within this 5 point scale gives me an idea of how volatile the market is. Keep in mind this is a 10 second chart. I think its crucial to read small time frames especially for a scalper. Plus you’ll have a better pulse on volatility shifts.
Using these scales and average rotations with simple price action can also give me an idea of just how big of a trade I can take.
If the market is rotating 5-10 points on average, then getting a 100 point move will be really difficult. On the opposite end of the spectrum, if we are rotating 1 point on average then a 10 point move will be pretty difficult to get.
You can want 10 point moves all day long. But if the average rotation isn’t there, well, then you’re shit out of luck. I know you could achieve this 10 point layup, but it will be more rare during low volatility and may only come 2 times a session. Hell, trying to time that move will be difficult as well.
This is where the noob fucks up. They try to go for these predetermined point values but don’t account for volatility. If it’s too low it’s like trying to pull teeth, if it’s super high you’ll feel like you’re taking candy from a baby.
See, noobs also think they can make a set amount of money per year. LMAO!!!!!
You make what the market gives you. It’s like being a farmer. One season the weather and rain are just right and you get fruitful crops. The next year, it’s a drought and you barely make anything. This, my friends is volatility in a nut shell. It’s sure a hell of a lot easier to do well in higher volatility. Because lets face it – the more a market moves – the faster it moves, the sooner you can pull a win, and a bigger win is more frequent. Therefore more money!!!
It can absolutely murder you too…..
This is where we will pivot.
Trade Management
Remember how I mentioned this quote earlier: “you need to adjust your risk according to volatility…“
Took me a long time to figure what that meant – more so how to do it.
Okay so how do you do it? Remember how I talked about price action is fractal? Range in a range?
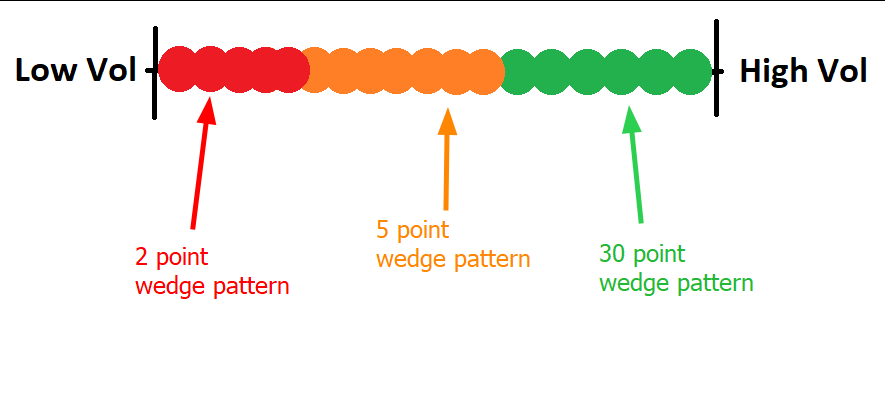
Price action throughout the entire volatility range stays the same. What this means is you’ll have a wedge pattern in low volatility and you’ll get that same wedge pattern in high volatility. The difference is one wedge pattern is 2 points tall and the other maybe 20 points tall.
It’s the same exact price action to a degree. You get way more overlap on rotations in high volatility vs low where the price will hold a specific tick for ages. You also get way more reclaims and slips in higher volatility vs low. That’s a more advanced price action conversation. If you know you know. If not, the only thing that matters is the price action patterns are the same. It’s just more stretched.
You should think of price action like a rubber band. When it’s at rest, it’s like low volatility. It won’t do much other than existing. However, if you stretch it slightly it will pop back with a bit of force. This is like volatility increasing. The further you pull the band the more force it has. The more force a rubber band has the more likely it breaks something like your skin and you bleed.
Volatility is like this. The market is more likely to experience breakout plays in high volatility vs low volatility. In low vol, the market can just go sideways for what seems like forever. However, don’t take this as some hard rule, because markets are grey. Not black and white. High vol markets can get stuck sideways.
Okay. Since price action is the same during different market regimes, other than a few nuances I mentioned, what can we do to figure out how to manage this?
What you need to understand is there’s 3 components of trading.
- You have the technicals of it. This means charts, order flow, or any information derived from the screens.
- Next you have the psychological element. After all, you are part of the equation. It doesn’t matter if you are a discretionary trader, or coding an algo to trade for you. You make the decisions you click the mouse.
- Finally, there’s the tether between you can the technicals. It’s called management. Below is a picture of these 3 components:
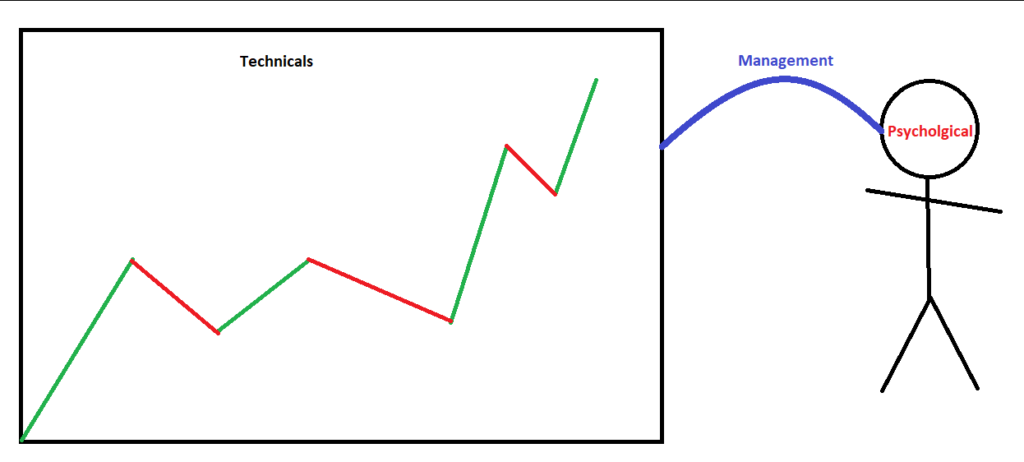
Without having all 3 of these things in check, your trading will suffer.
One thing you can do is use the Trade Craft Software and have tags for each of these 3 groups. This is something I currently do. Here’s a picture below showing this:
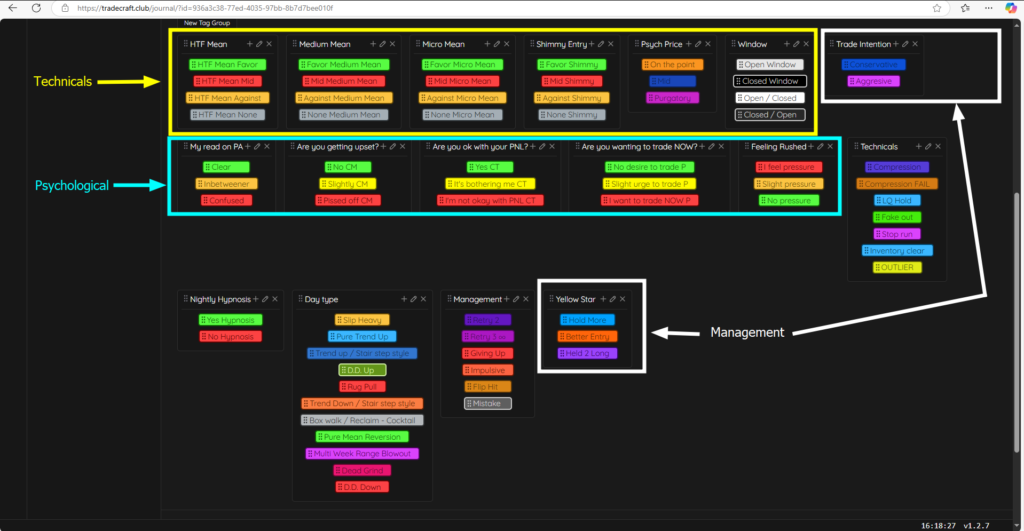
Since management is the bridge or tether between you – psychological – and the technicals, it’s important to have these two things dialed in. Management will be a lot easier. Otherwise, if your clarity on the market tehcnicals is off and you’re getting impatient, then no amount of management will fix poor trading decisions. Clarity is arguably the most important ingredient and comes first.
Assuming you got the psychological and technical clarity in place then we can fine tune our management.
Let’s pretend you are a scalper like me. In VIX 14 which is shit volatility, you average 4 tick wins. Or 1 point. You’re consistent in this environment. As VIX elevates to 20, you notice you get instantly blown out because your trading is still tight. You take loss after loss right away. Here’s the thing:
This has happened to me before, and as I reviewed my recordings, I realized on the management side I could push my wins for 8 – 12 tick wins or 2 – 3 points on average. I’d widen the stops and all of a sudden, things started working better.
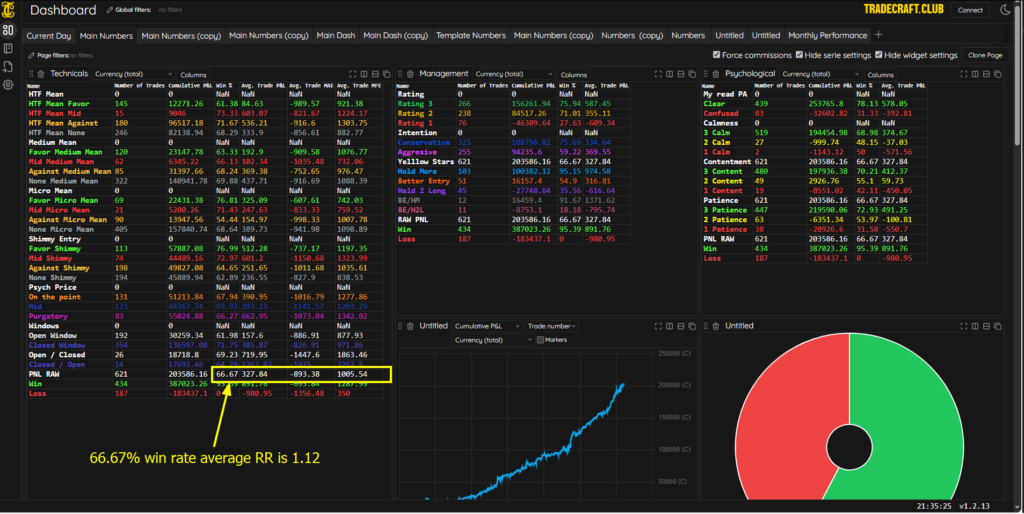
Currently, as of writing this, it’s Trumps 2nd term and we have Chinese trade wars going on with a VIX around 50+
At this point, I’ve widened my stops by 15-20 points or close to 50 ticks. However, I can get about the same on the winning side. Just in case you’re wondering, my current win rate is 66.67% with an average RR of 1.12.. Basically 1 to 1.
With that being said, the price action is the same. The trades are the same when volatility expands and contracts. Therefore, one needs to know how to adjust their risk and reward. You must expand risk in higher VIX. Otherwise you’ll get railed on every trade if the stops are too tight for that environment. You also need bigger targets to offset the bigger losses.
I consider myself to be a sniper, but I can’t even get in super precise without the need for some breathing and wiggle room on the trade.
It really is like a rubber band. Same price action, same trades, just more stretched or contracted so the risk and reward must be adjusted to compliment that.
Using those yellow lines I showed earlier every 5 points and seeing how price rotates in them gives me an idea of what my average risk on the stop side as well as target have to expand to. I still maintain roughly the same RR, but there’s just more wiggle room.
If I see the average rotation is 20 points, then I should be going for a minimum of 5 points. Whereas 5 points in a low VIX environment is a home run for me.
Now there’s another thing we should look at here: Regime shift in the price action. VIX 20 for example.
VIX 20 price action isn’t the same from day to day. There’s days that trend. Puke low. Range. Fake out. So what this means is I have to manage differently for these different types of sessions.
Sometimes a VIX 50 where you can get a minimum of 5 points tightens up so much that you have to go for smaller scalps like 12 ticks or even 4 ticks.
This is more complex and management is a discussion I could write a book on.
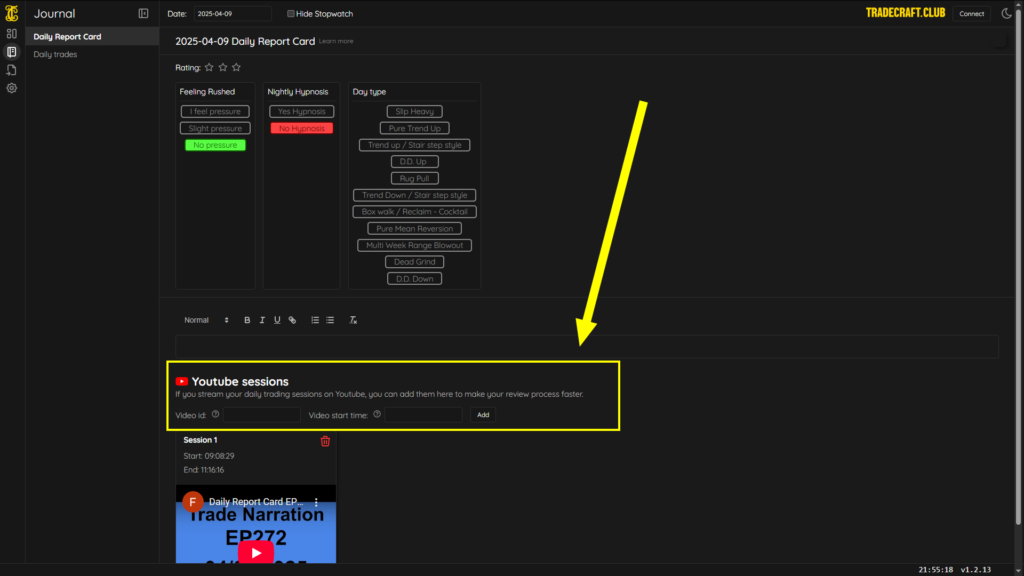
One thing I recommend is to record your sessions. You can easily store thousands of videos on YouTube for free. Then you can take those sessions and put them in the Trade Craft journal. Our software automatically finds you entries for each trade. So when you look at individual trades, the correlated video is there with that specific trade entry playing.
You’re going to want to track your management through tags:
Are you too early on the entry?
Held too long on the trade and it came back on to you?
Did you need to hold more?
This is vital information. If trades keep coming back then that’s telling you you’re trying to get too much from the market. So bring the profit target in.
If the trades have more room to run and you’re cutting too soon, then that’s telling you to push more.
Here are my tags for management:
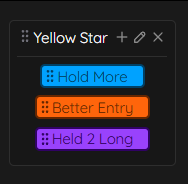
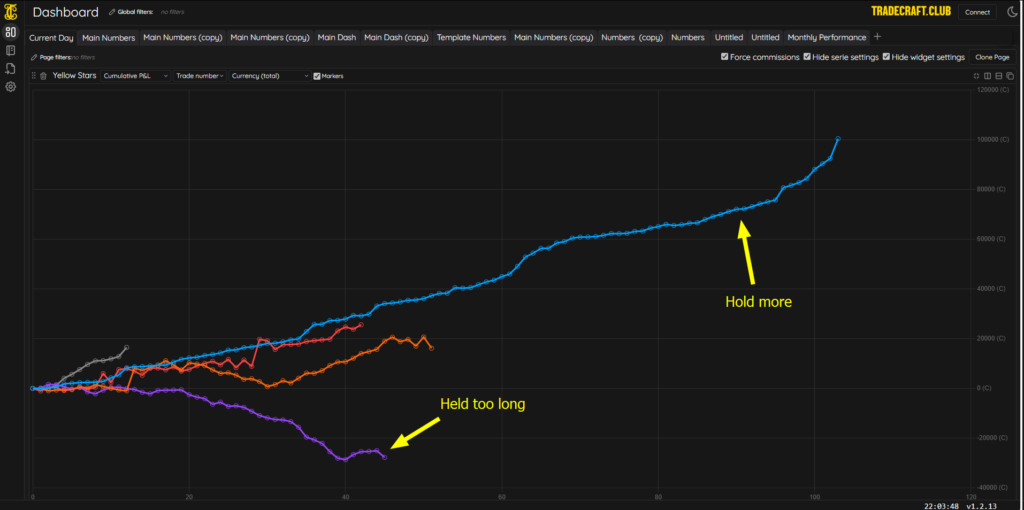
As you can see above, I’m taking a ton of trades where I need to hold longer. Keep in mind – just because it shows I make money on this tag – doesn’t mean it’s good. I’m leaving too much money on the table.
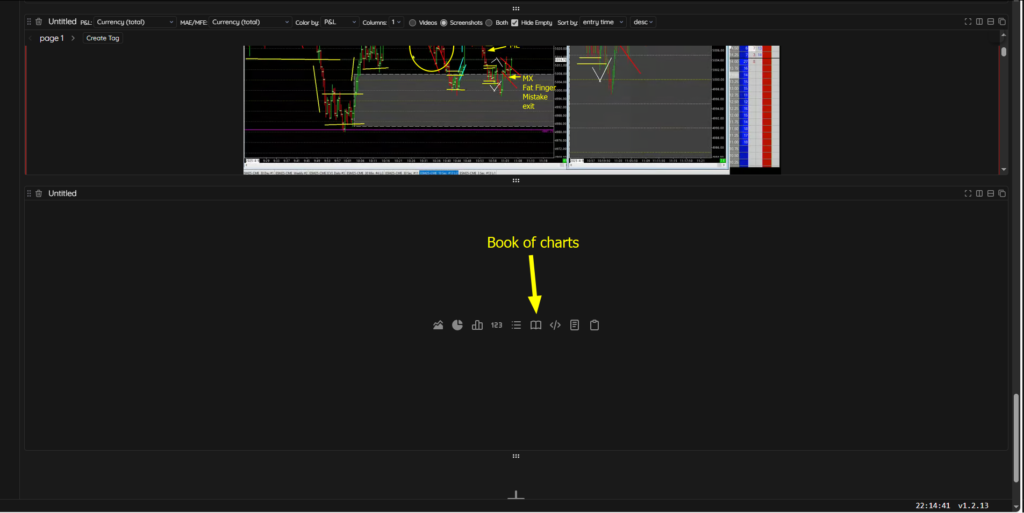
Trade Craft has a book of charts. What I recommend doing next is labeling your screen shots using the free screen recording and annotating tool called Flame Shot, which you can download here.
I label ME for My Entry – MX for My Exit – IE for Ideal Entry – IX for Ideal Exit – on my charts. Here’s an example:
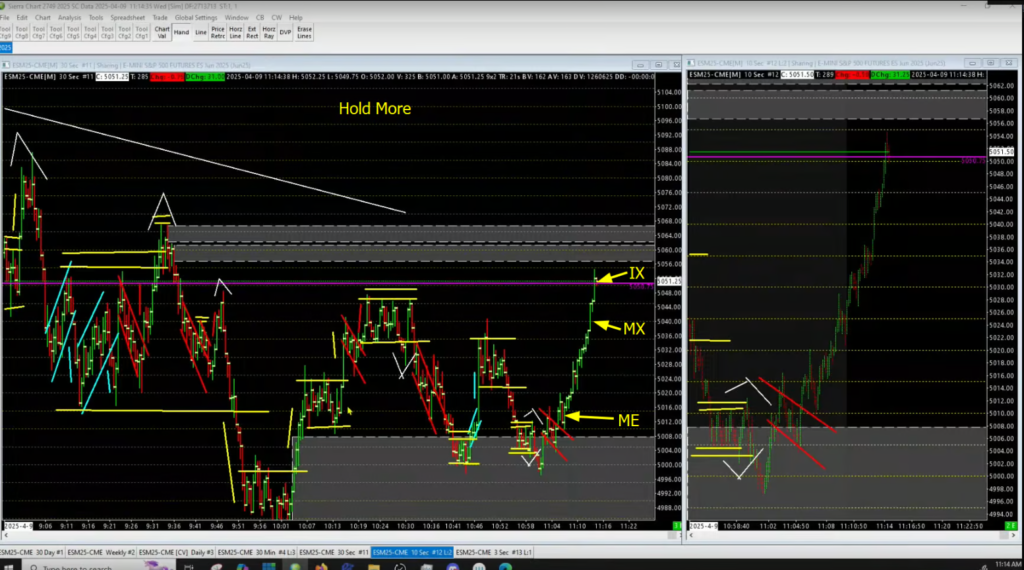
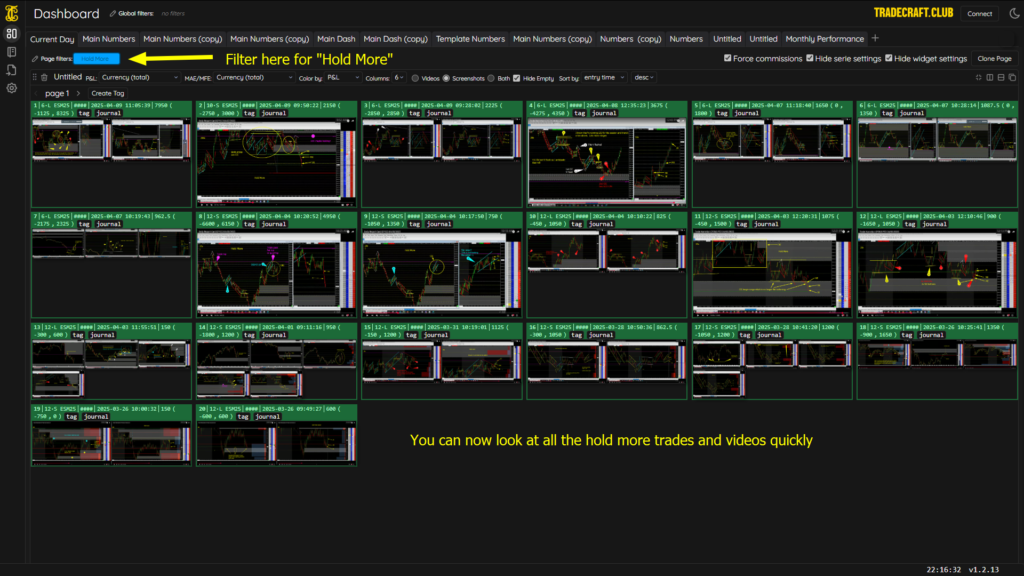
You can see it also says “Hold More” at the top. When I filter out the hold more tag on the Trade Craft dashboard – Ill be able to see all the screen shots of trades I needed to hold more. Then I can see the labels of where on the price action I needed to push the trade to. Because after all – a hold more tag can refer to a few extra ticks I needed to hold for or 20 extra points. So there’s a huge difference.
There’s a widget which is your book of charts:
I’ll say that it is very important to label your screen shots in a way you can understand what the trades are. More details means less likely to forget what these screen shots means. You can then flip through them quickly like flash cards internalizing the price action and how you should adjust your management.
I hope you find this all useful. I’ll see you in the next one.