
Getting Started Step-by-Step Guide
7 min read
This step-by-step guide will help all users of the TradeCraft journal software get started with configuring their dashboard, importing trades, tagging, daily report card, and creating their book of charts.
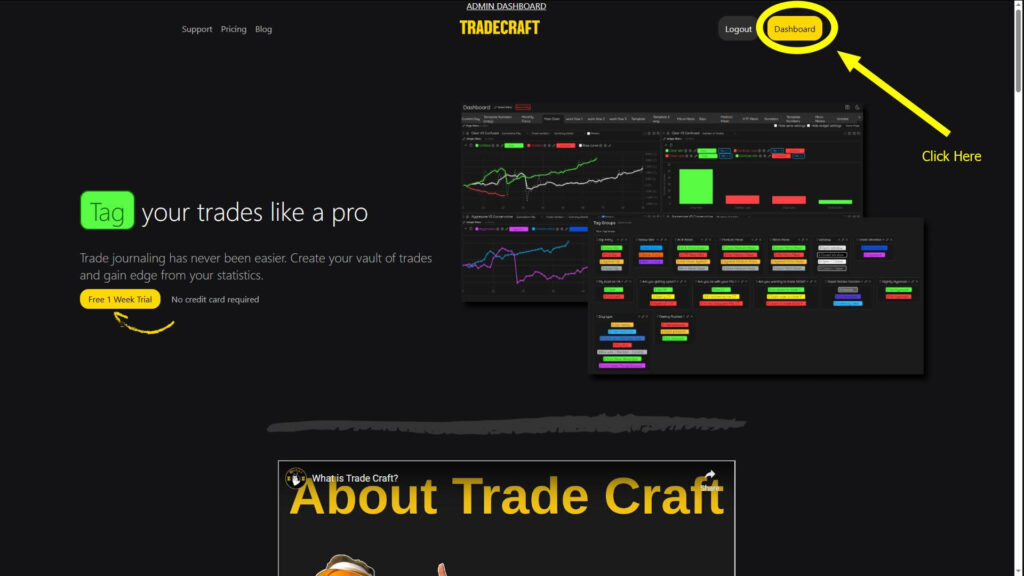
After you have signed into your account, simply click the Dashboard button in the top right corner.
Creating Your First Journal & Importing Trades #
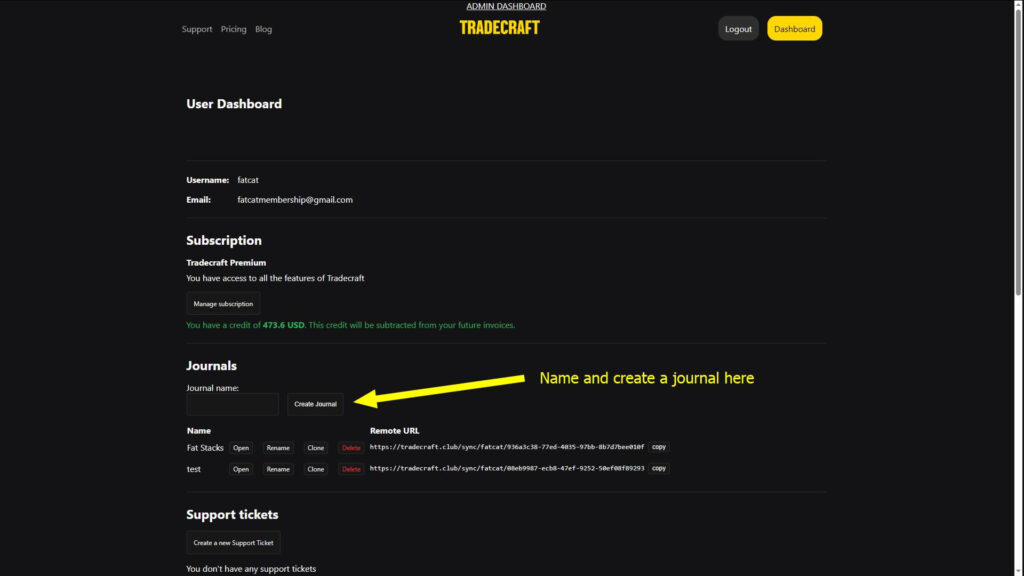
Name and create a journal then click open after it’s been created:
If you’re using Sierra Chart or Rithmic for your data providers, then your trades can be imported in real-time. To connect TradeCraft to Sierra Charts click here.
If you’re a Rithmic user, then you can use TradeCraft Beacon. Click here to connect Rithmic to TradeCraft.
If you are not using Sierra Chart or Rithmic, then you will need to use the manual import tab within the journal. Sierra and Rithmic users can also use the manual import process if they wish.
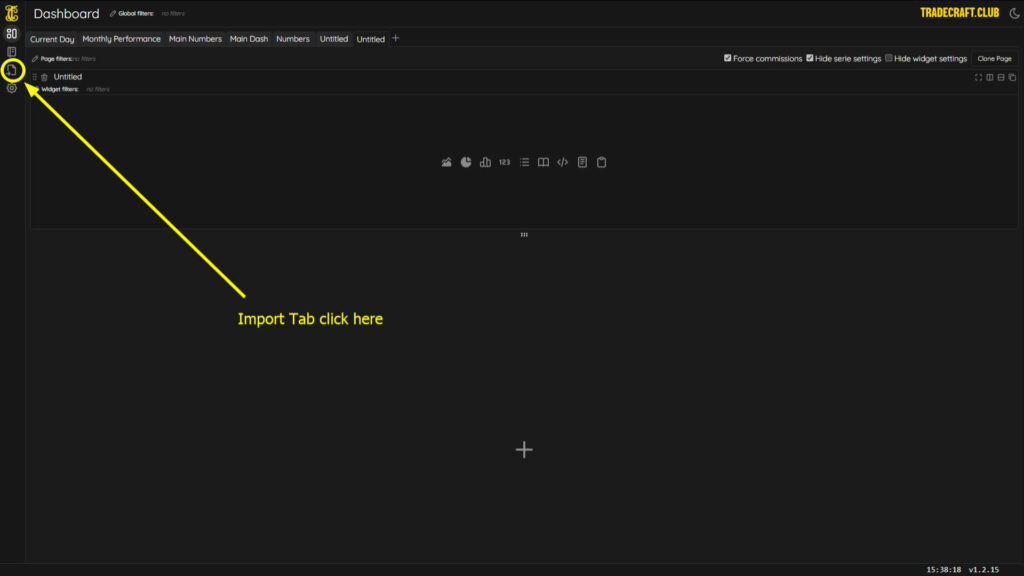
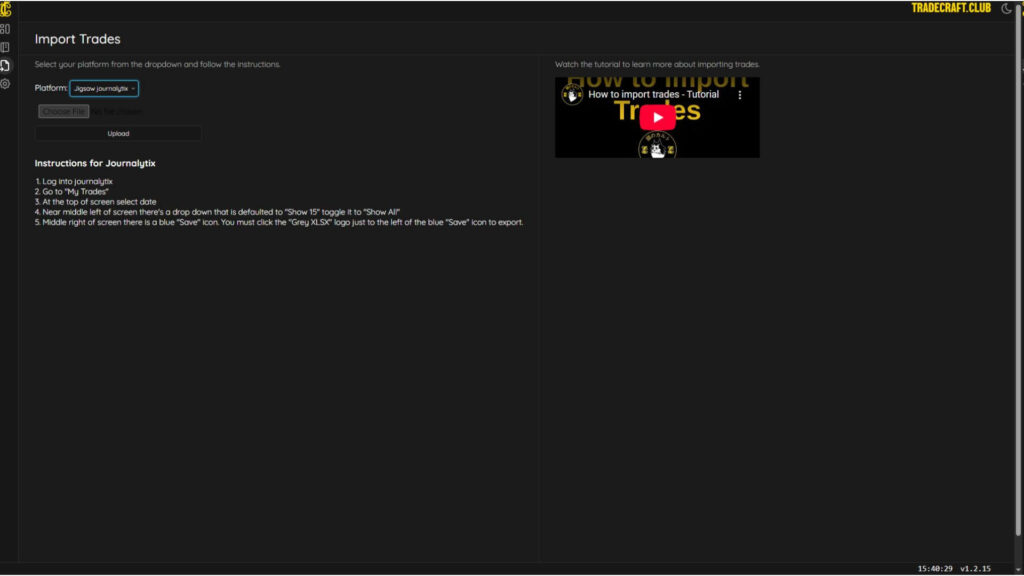
First, click on the import tab on the left navigation menu:
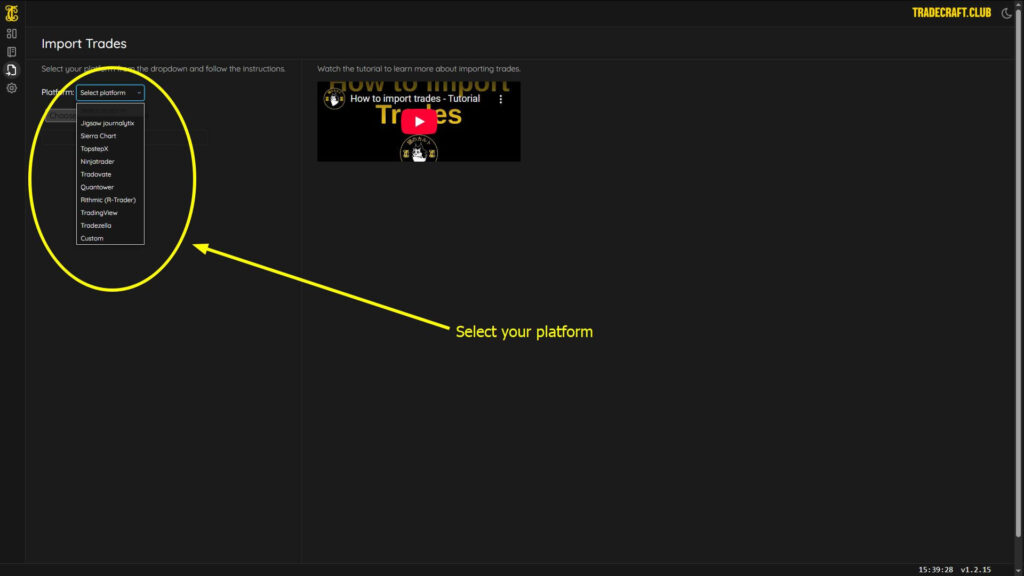
Next, you will select your platform from the drop down menu:
After you select your platform, you will see instructions on how to obtain the trade data/file that’s needed for import into TradeCraft. You can also view this knowledge base article for platform import instructions. For example, below shows how to import data from the JigSaw DayTradr platform.
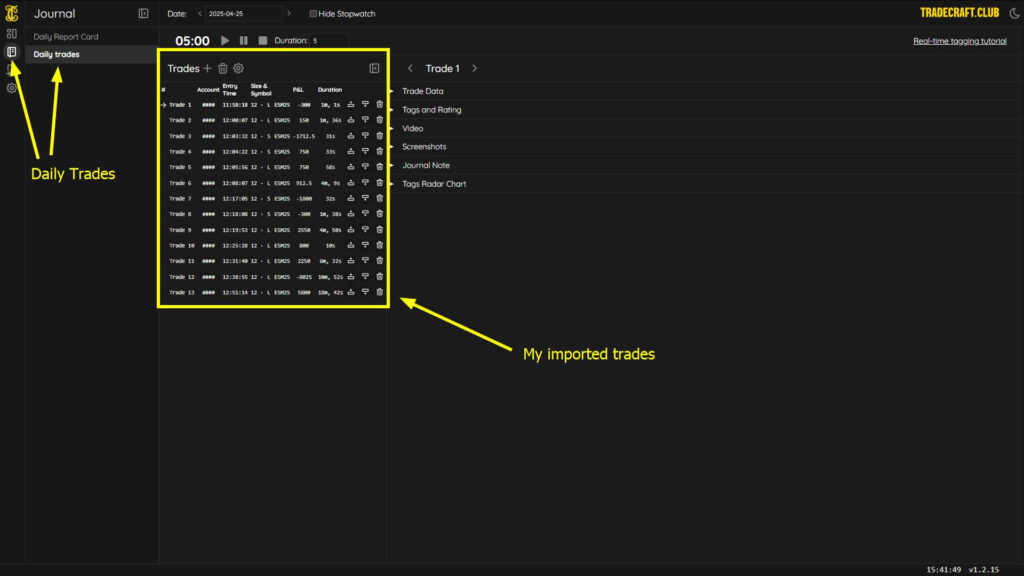
Finally, your trades will be imported into TradeCraft and they will be visible under the journal tab on the left navigation, then in the Daily Trades section:
Creating Tags and Tagging Trades #
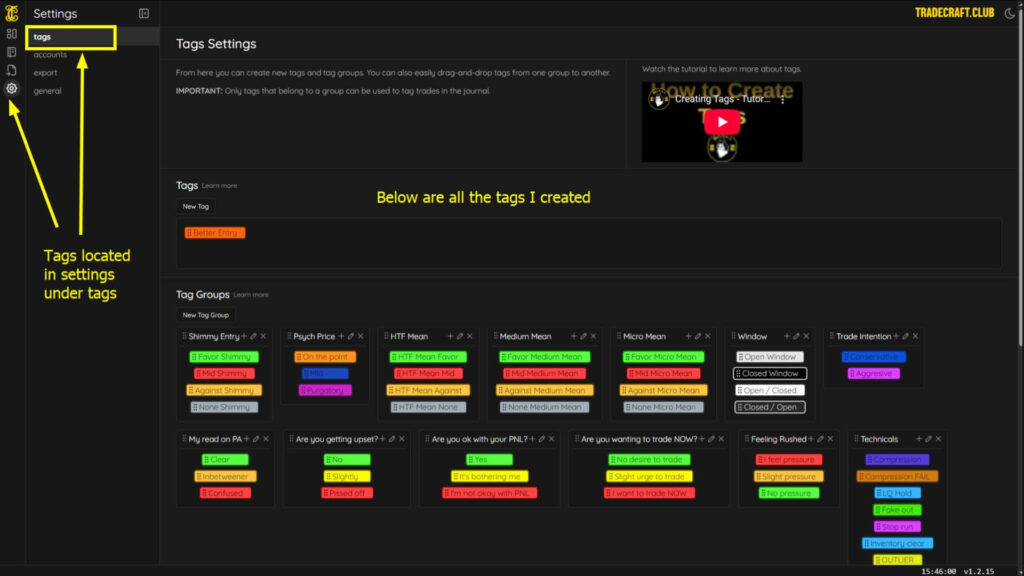
After you have trade data imported into TradeCraft, you will need to create tags – check out the creating tags tutorial to have a more in-depth look on tagging. To add tags, navigate to the settings section on the left navigation menu, then click the Tags tab. We recommend following the knowledge base articles related to Creating Tags and creating Tag Groups to get started with adding tags and tag groups.
Once you have created some tags and some tag groups, you will then go back to the journal on the left navigation menu, then click on the Daily Trades tab on the left.
Adding Data to Each Trade #
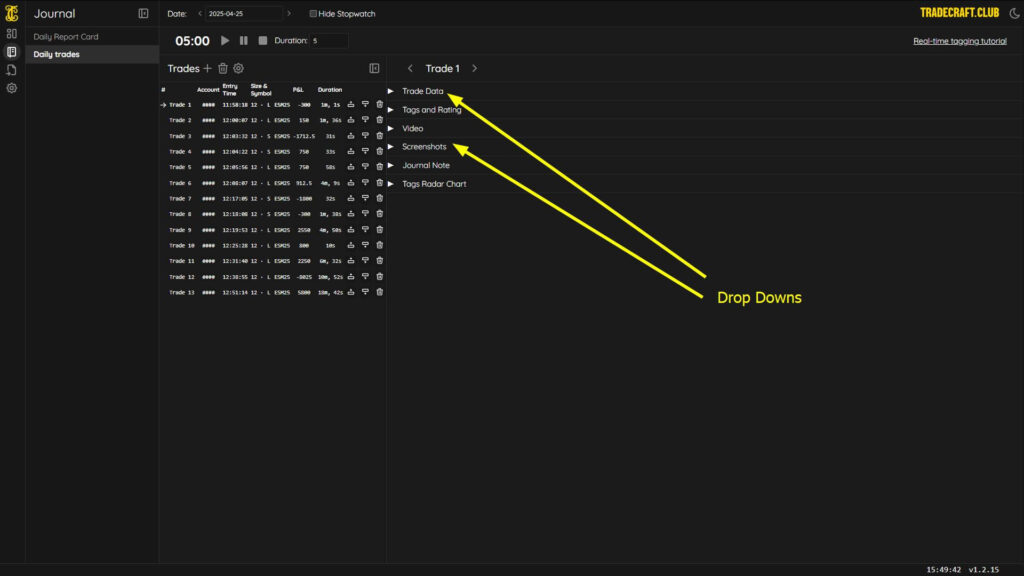
Within the Daily Trades tab, you will see several options that you can click to expand. This is where you can add different pieces of trade data to each trade. You can learn more about each of these sections in this knowledge base article, however, we will outline each of these sections below.
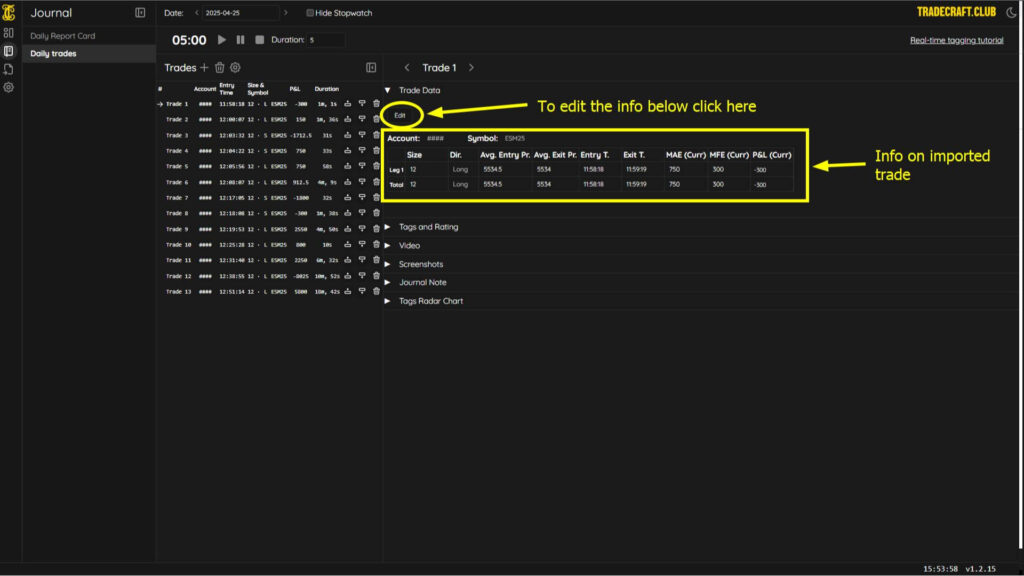
Trade Data
Trade data is generic information on the trade. There is an edit tab and you can adjust this information. You can also create trades here if you aren’t able to import a trade. For example if you missed a trade, but want statistics on it, you can create one in this area (these are called “dummy trades” – that is, trades that you may have taken mentally, or if you are trying to see how a particular strategy works out, you can enter the information here as a new trade and adjust accordingly).
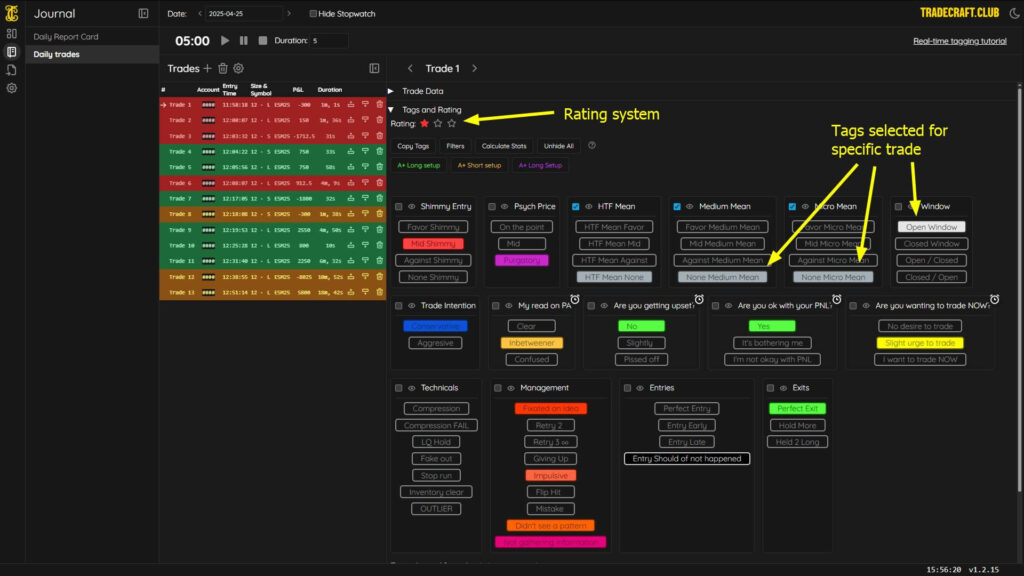
Tags and Rating
The next step is to apply and rate tags to each trade. The tags you selected will glow with the color you chose when you created the tag. De-selected tags won’t have any color. If you are tagging live during a trading session, please see this knowledge base article on live tagging. To understand and use the rating system, please see this knowledge base article on the rating system.
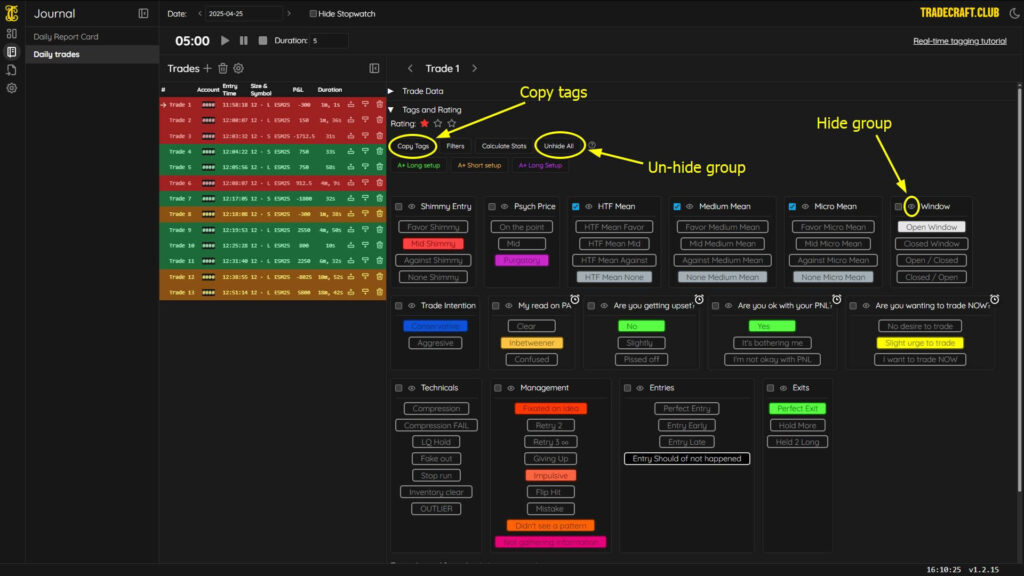
You can also clone tags by clicking the ‘Copy Tags’ button. This is especially helpful if some of the tags you use are consistent from trade to trade. This makes it easier to copy between each trade, without having to manually re-add them for each trade.
It’s possible to hide entire tag groups to free up space, and hide tag groups that are not being used for each trade.
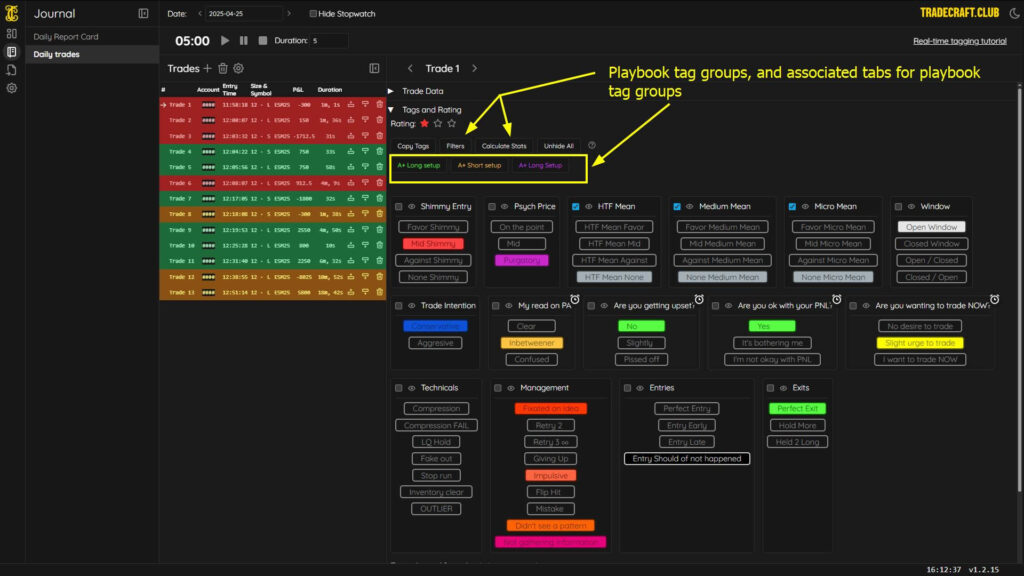
Finally, you have Playbook Tag Groups (available to Premium and Lifetime members only), which allow you to organize your trades based on tags and tag groups that you have found to have statistical edge. This makes it easy for you to see which setups work the best and which setups work the least and allow you to further analyze each trade that consists of these setups. For a better understanding of the playbook tag combo, please see this knowledge base article.
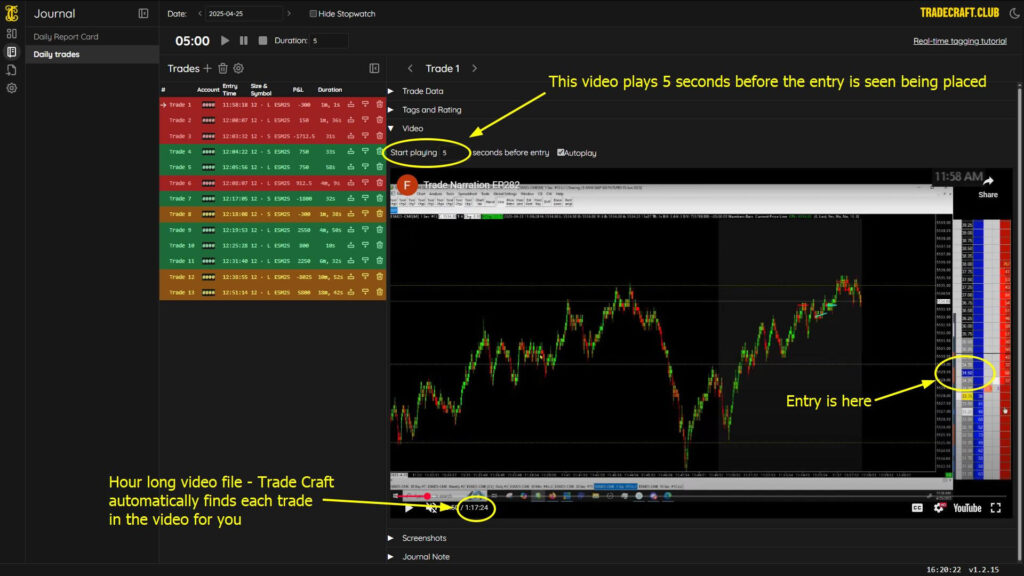
Video #
The video tab is for those that record their trading sessions and stream (or upload) them to YouTube. YouTube is the best place to store video files without slowing down your computer, or filling up your local hard drive. It’s quite simple to setup Open Broadcaster Software to stream your trading sessions to a private YouTube channel. This will be required if you wish to be able to review your trades through TradeCraft, as well as add data to your book of charts. Trade Craft will automatically sync the recorded entry of your trade. When you click on the video tab, you can watch the recording of the entry without searching a multi-hour video file. You can also adjust how many seconds before entry you would like the video to play to get context before you see the entry placed. Review this knowledge base article on Adding YouTube recordings to TradeCraft.
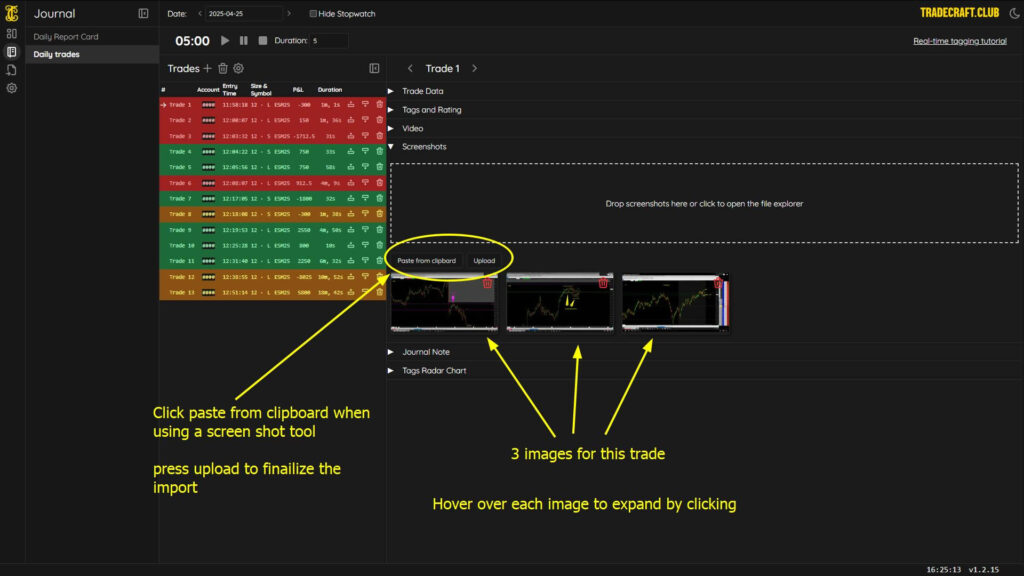
Screenshots
In the screenshots section, you will be able to upload screenshots for each of your trades. Free plans are unable to upload any screenshots, while Basic members can upload 2, and Premium and Lifetime can upload 5 screenshots per trade. We recommend using FlameShot for taking and annotating screenshots. This also allows you to simply copy and paste your annotated image directly into the screenshots tab on TradeCraft. You can also either upload the screenshot by navigating through your system’s file explorer, or you can drag and drop the images to be uploaded. Any standard image type is allowed.
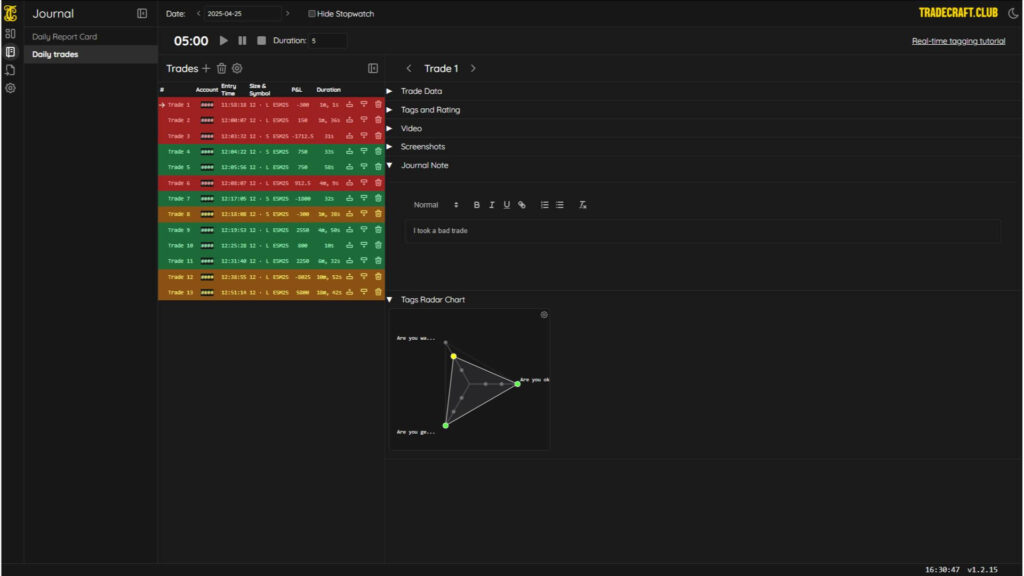
Journal Note
This section allows you to type in your thoughts or any notes related to the trade.

Tags Radar Chart (Beta)
The tags and Radar chart is a feature that’s still in beta, and will be fleshed out in the future. Currently, there is one widget in here, however, you can add multiple tag groups in this section. For example, you can add tags related to emotions. You will then see how you’re performing. This shows 3 emotion groups: Patience, Contentment, and Calmness. The triangle is not full, so I can see patience was an issue.
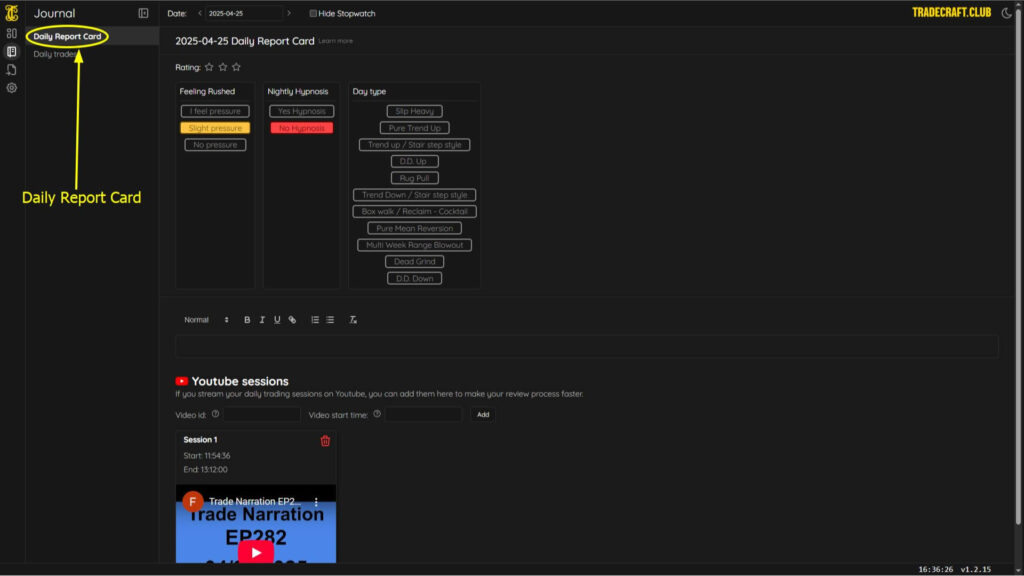
Daily Report Card #
The daily report card section is where you will add stats and information related to the entire trading session. You can add daily tags, as well as the recording from the entire session. Just like with individual trades, you can rate your entire trading session and add notes. You can look at prior trading sessions by using the date menu at the top. Adding your trading session recording to the daily report card is a little different than adding it to individual trades. Please review the adding YouTube recordings knowledge base article, and jump to the 7:00 (7-minute) mark to view how to add the entire recording to the daily report card. To access the daily report card, click on the journal icon on the left navigation menu, then click on Daily Report Card on the left:
The Dashboard #
The dashboard is the “heart and soul” of TradeCraft, and is where you will likely spend the most time analyzing your trades and data to help find your trading edge, as well as to see where you can improve and potentially find any psychological related issues that may be impacting your trading. TradeCraft provides several widgets that can be added, that will allow you to analyze your statistics and visualize the data accordingly. Our customizing the main dashboard knowledge base article goes further in-depth on the features of the dashboard.
You can create multiple pages on your dashboard, and rename them at the top. On a blank page, you can then create various types of charts and utilize the analysis tools provided to build out the page to your liking.
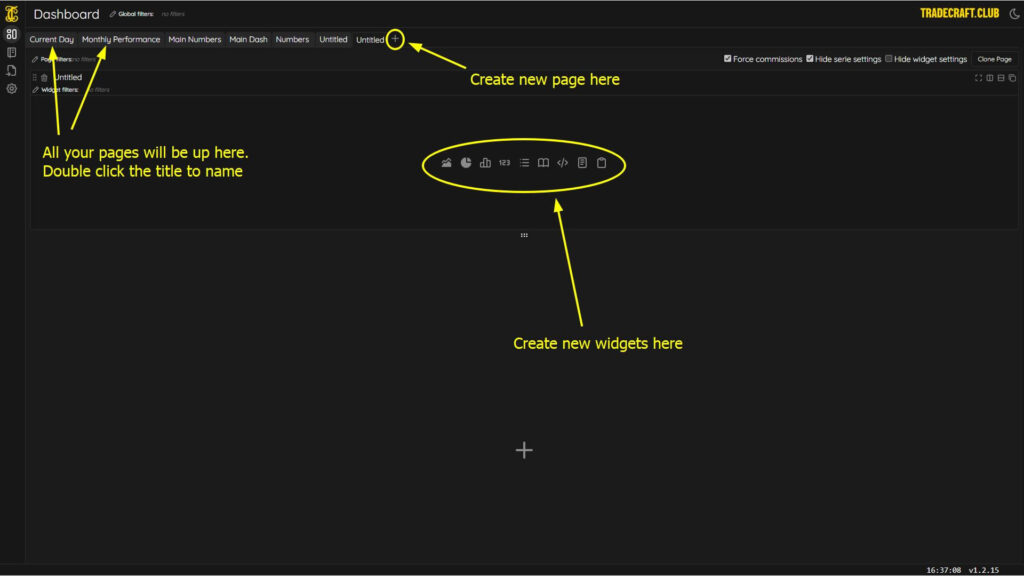
Here’s a list of the different widgets that can be added, and what they are:
- Widget 1: Equity Line Chart
- Widget 2: Pie Chart
- Widget 3: Histogram
- Widget 4: Statistics Table
- Widget 5: Trade Table
- Widget 6: Book of Charts
- Widget 7: Custom JavaScript Widget – Allows you to code your own widget with your data.
- Widget 8: Note Widget
- Widget 9: A clone tool, that allows you to clone a widget you built into another page.
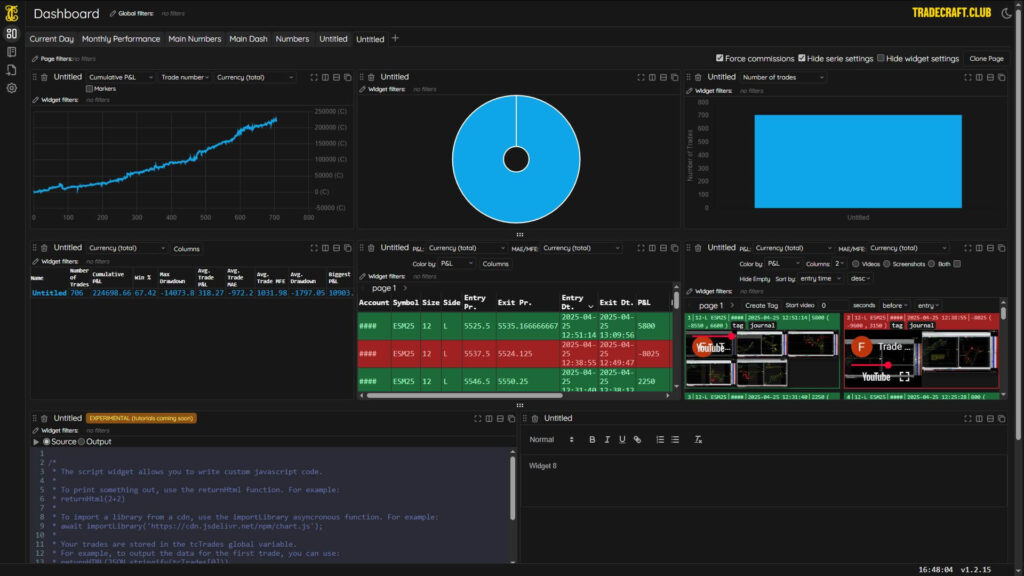
In the image below, you will see all of the widgets (except widget 9) added to a page in the dashboard. They are in order from left to right as explained in the list above from top to bottom (the Equity Line Chart is the blue line in the top left image, the pie chart next to that, etc.):
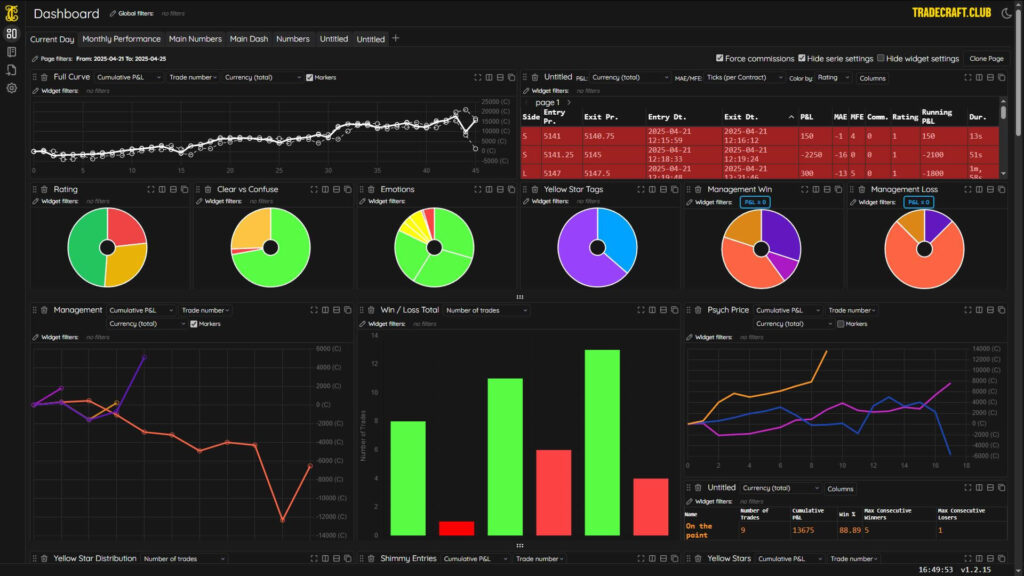
Each widget and most elements contained within the dashboard and through TradeCraft have the ability to have different types of filters added to them, to further refine the data. Below is a screenshot that shows a custom dashboard that has several different filters applied to each widget:
Book of Charts #
The book of charts is a professional feature that is available to all membership plans. It is a more advanced tool, and therefore the knowledge base article for the book of charts should be reviewed.
Getting Additional Support #
While this getting started guide should be sufficient to get you up and running with TradeCraft, there are certainly a number of additional features and options that are not covered. We highly recommend that you review our extensive knowledge base here. The knowledge base includes comprehensive case studies that were used to help traders find their edge. If you still need additional support, or if you feel lost with using TradeCraft, you can submit a support request here, or for a more community-like experience, join our Discord server here.