
Calculating Trades in R-Value
4 min read
TradeCraft now allows users to view their stats as a value of R. Using R value, allows traders to determine their initial risk on the trade, based on risk-to-reward, as opposed to dollar amounts. In order to calculate R, the planned stop and planned target are required for each trade. With this information, you can determine what the outcome of the trade would’ve been, had you let it be and not actively managed it. This is helpful to see how your trading strategy is working, if you are constantly hitting your planned targets, but exiting the trade manually too soon.
When adding a trade in TradeCraft, you can now add the planned target and planned stop to the trade parameters, which can be used for graphing how your trades and setups perform.
Adding R Value to Trades #
Under your journal, click on Daily Trades, then select a trade that you wish to modify.
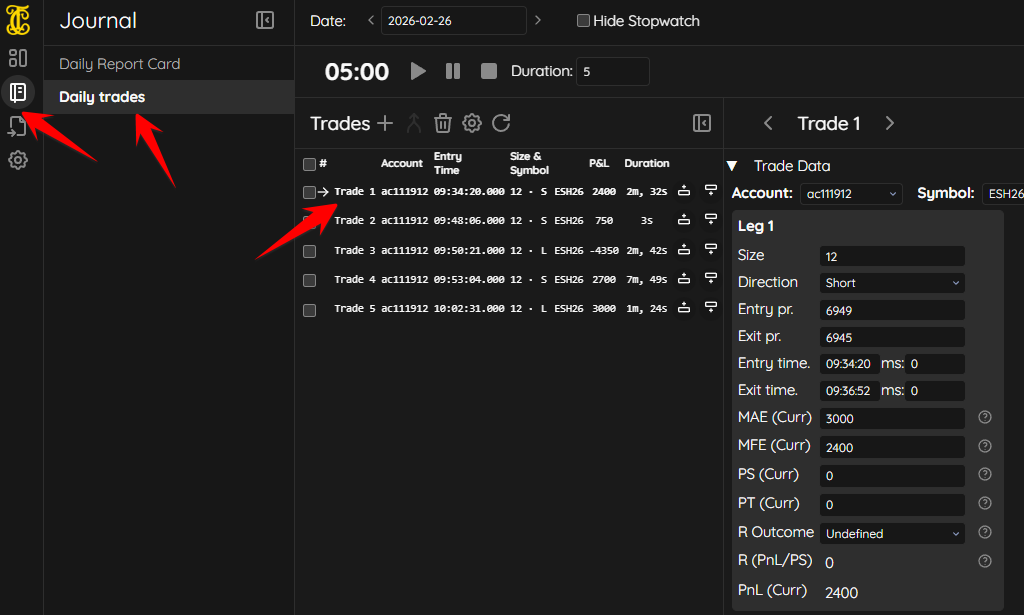
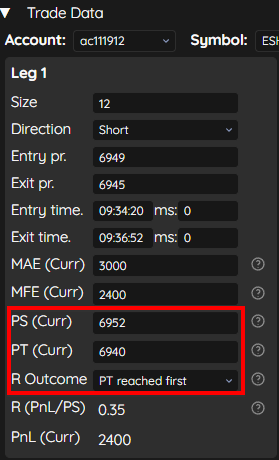
To determine your R values on the trade, you will need to enter the price (value) of the Planned Stop (PS), Planned Target (PT), as well as the R Outcome (managed vs. unmanaged). This will either be in the value of the instrument (price) or ticks, depending on how you have your journal configured. If you leave the R Outcome set to undefined, then you will not be able to use the results from the R value anywhere in the journal. The Planned Stop, Planned Target and R Outcome information and need to be manually configured for each trade that is imported/entered into TradeCraft.
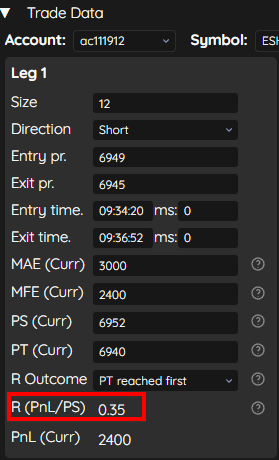
After you input the Planned Stop, Planned Target and R Outcome, you will see the R value for that specific trade next to R (PnL/PS)
Visualizing R Value on the Dashboard #
Once you have entered Planned Stop, Planned Target and R Outcome to your trades, you can now use many of the widgets on your dashboard to view how the trade would’ve worked out based on the R value.
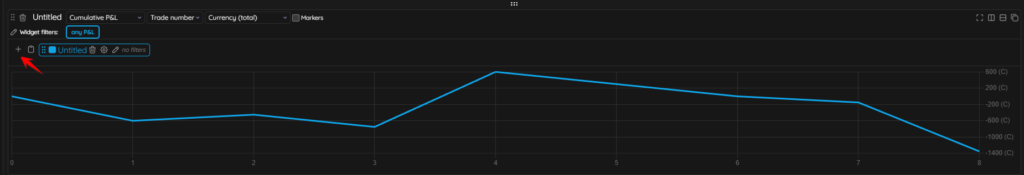
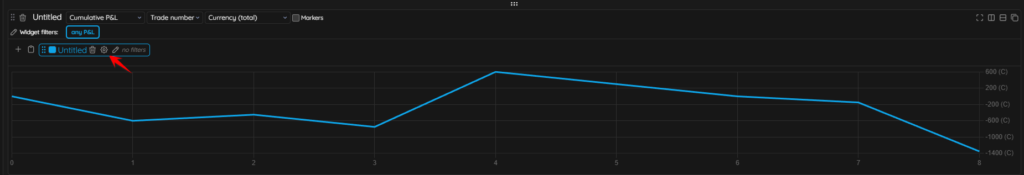
Navigate to your dashboard and either create a new section, or work with a pre-existing section and add a filter that you want and select the graph type that you wish. We are using line chart in our example below. You will then want to click the plus + sign on the left to add a series.
Click the gear icon next to the series name:
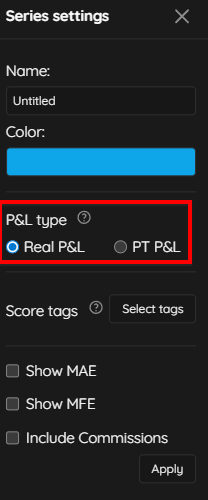
The series settings window will appear, which will allow you to change the P&L Calculation type from Real P&L, or the Profit Target P&L:
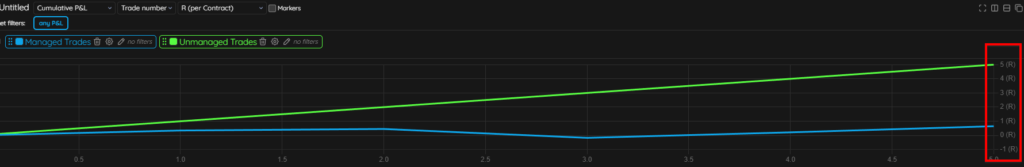
You will now see two lines plotted, your actual P&L from your “managed” trades, and the P&L from the unmanged trades, based on your original Profit Target (based on what you entered for each trade’s Planned Target (PT), Planned Stop (PS), and R Outcome above).
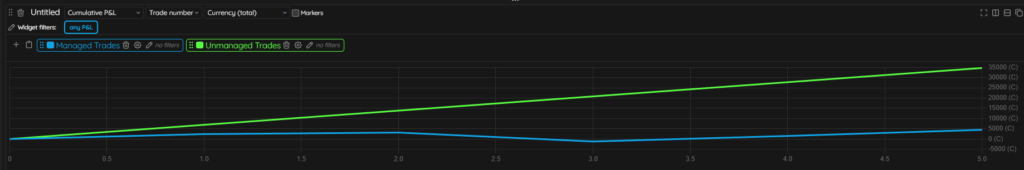
Trades that hit the Planned Stop first will show as dips in the line and trades that show as Planned Targets were hit first will show as spikes in the line. This allows the trader to see if manually managing each trade is costing them money or not, based on the parameters of the Planned Stops and Targets and which was actually hit, vs. how the trader executed manually. If the Managed Trades P&L line and the Unmanaged Trades P&L line are perfectly aligned with each other, then the trader is executing perfectly.
Showing Data in R Value on Widgets/Graphs #
If you prefer to see you the trade results and values as a measure of R instead of currency, for any widget, click the dropdown for currency and change it to R (per contract):
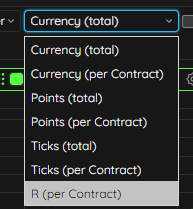
You will now see the values scale of the widget change to R value instead of currency value.
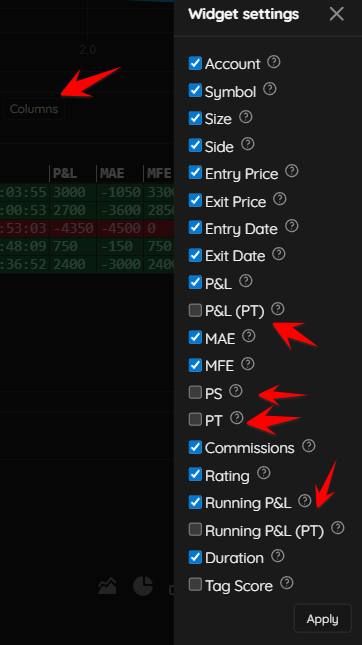
If you wish to see the Planned Target, Planned Stop and the possible P&L outcome from that data on the Trades Table widget, simply click the columns button at the top of the trades table widget, then tick the boxes next P&L (PT), PS, PT, and Running P&L (PT):
Just like with other widgets, you can also view the trades table in multiples of R by clicking the currency dropdown and selecting R (per contract).